
PUBLICATIONS
CONNECT THE DOTS SERIES
This is a three-report Connect the Dots series to demystify and democratize access to information about how Oregon’s statewide public K-12 education system is designed to get the outcomes it gets.
The first report starts with connecting the dots between education governance (who is in charge and for what) and student outcomes.
The second report connects the dots between education goals and how well statewide systems of accountability help improve student outcomes.
The third and final report connects the dots between education funding, spending, and student outcomes.

SUBSCRIBE TO THE SUBSTACK
BRIEF WITH EQUABLE INSTITUTE
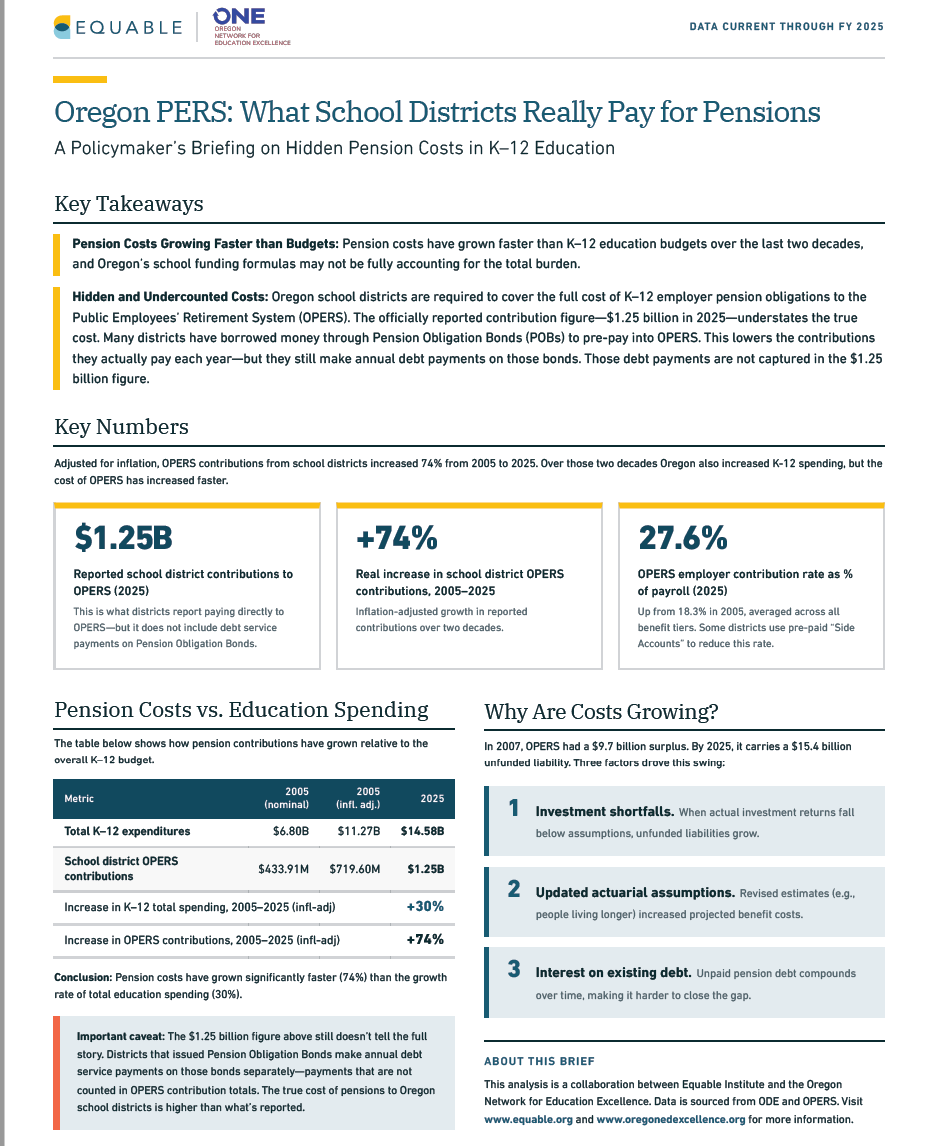
Oregon PERS:
What School Districts Really Pay for Pensions
This brief was developed by the Equable Institute, a bipartisan nonprofit dedicated to making public retirement systems work. Equable sits at the intersection of retirement policy and broader public policy, equipping policymakers, public employees, and retirement plan managers with independent, data-driven research, analysis, and education.
IN EQUABLE’S BRIEF
“Oregon school districts are required to cover the full cost of their K–12 employer obligations to the Public Employees’ Retirement System (PERS). In 2025, districts reported contributing $1.25 billion to PERS, but that figure does not capture what districts pay in debt service on the pension obligation bonds many of them issued to pre-fund their PERS accounts. This interactive brief examines the gap between reported contributions and total pension costs, drawing on Oregon Department of Education revenue and expenditure data and PERS actuarial valuations.
The analysis tracks how district PERS contributions changed between 2005 and 2025, a period in which reported contributions rose 74% after inflation while total K–12 expenditures rose 30%. It documents the swing in the PERS system from a $9.7 billion surplus in 2007 to a $15.4 billion unfunded liability in 2025 and the factors behind it: investment returns below assumptions, updated actuarial assumptions, and interest compounding on existing pension debt. Using district and county financial statements, it estimates that Oregon school districts made more than $321 million in pension obligation bond payments in FY 2025 alone, which fall outside the reported PERS contribution total.
The brief also situates Oregon among other states. Twenty-seven states plus Washington, D.C. contribute toward K–12 school district pension obligations. Oregon does not, leaving individual districts responsible for both normal costs and their share of unfunded liability payments.
Explore the interactive charts [here] to see the underlying data on pension debt, funded ratios, and the composition of what districts actually pay.”
This research was produced by Equable at the request of the Oregon Network for Education Excellence.
FACT SHEET
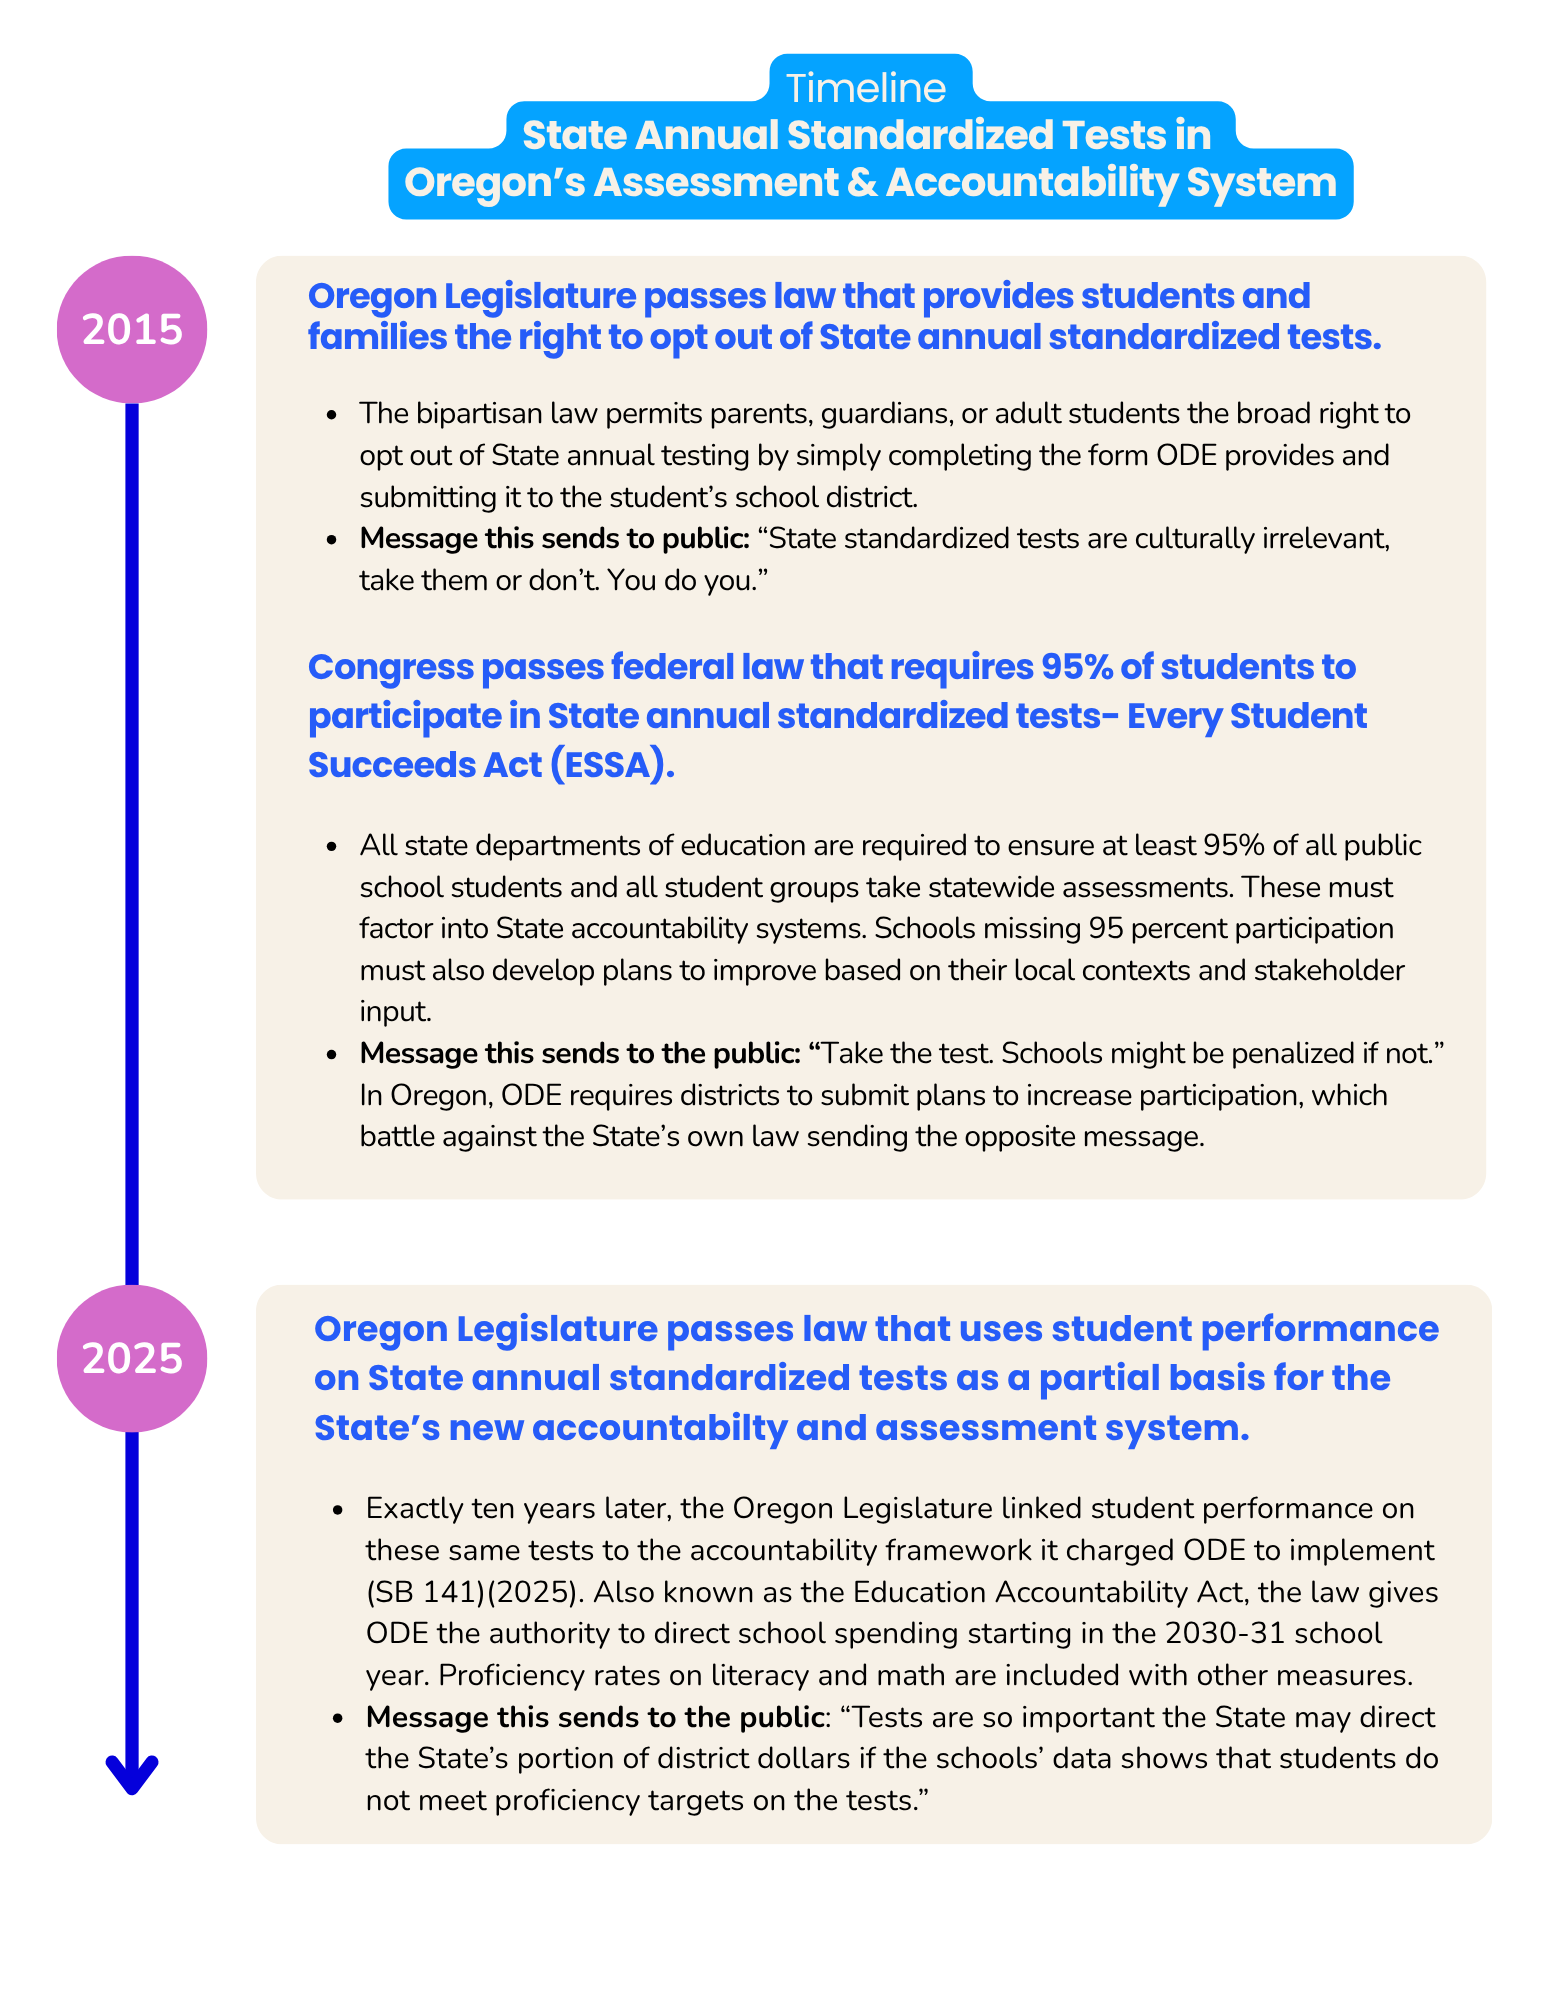
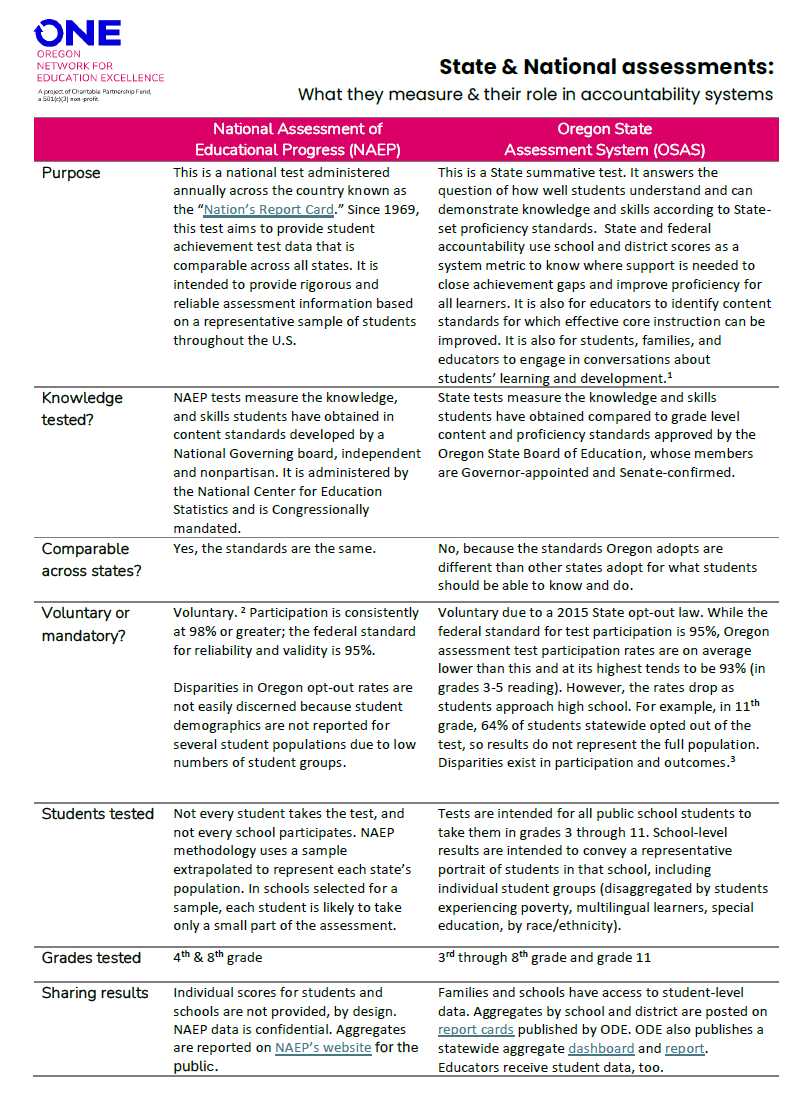
State & National assessments: What they measure & their role in accountability systems
This fact sheet compares NAEP (National Assessment of Educational Progress) and Oregon assessments. There are major differences in purpose, knowledge tested, and comparability across states.
IN THIS FACT SHEET
NAEP is the only nationally standardized way to know how students in different states compare in literacy, math, and science proficiency
NAEP tests for national standards, whereas Oregon assessments test for whether students meet State-directed standards
Both are voluntary, but Oregon assessments have less participation
Both NAEP and Oregon assessments provide data about how well schools statewide are performing in helping students meet proficiency targets.
Not every Oregon student takes NAEP because it’s based on a statistically representative sample of Oregon’s student population. However, every Oregon student in grades 3-9 and in grade 11 must take Oregon assessments.
FACT SHEET
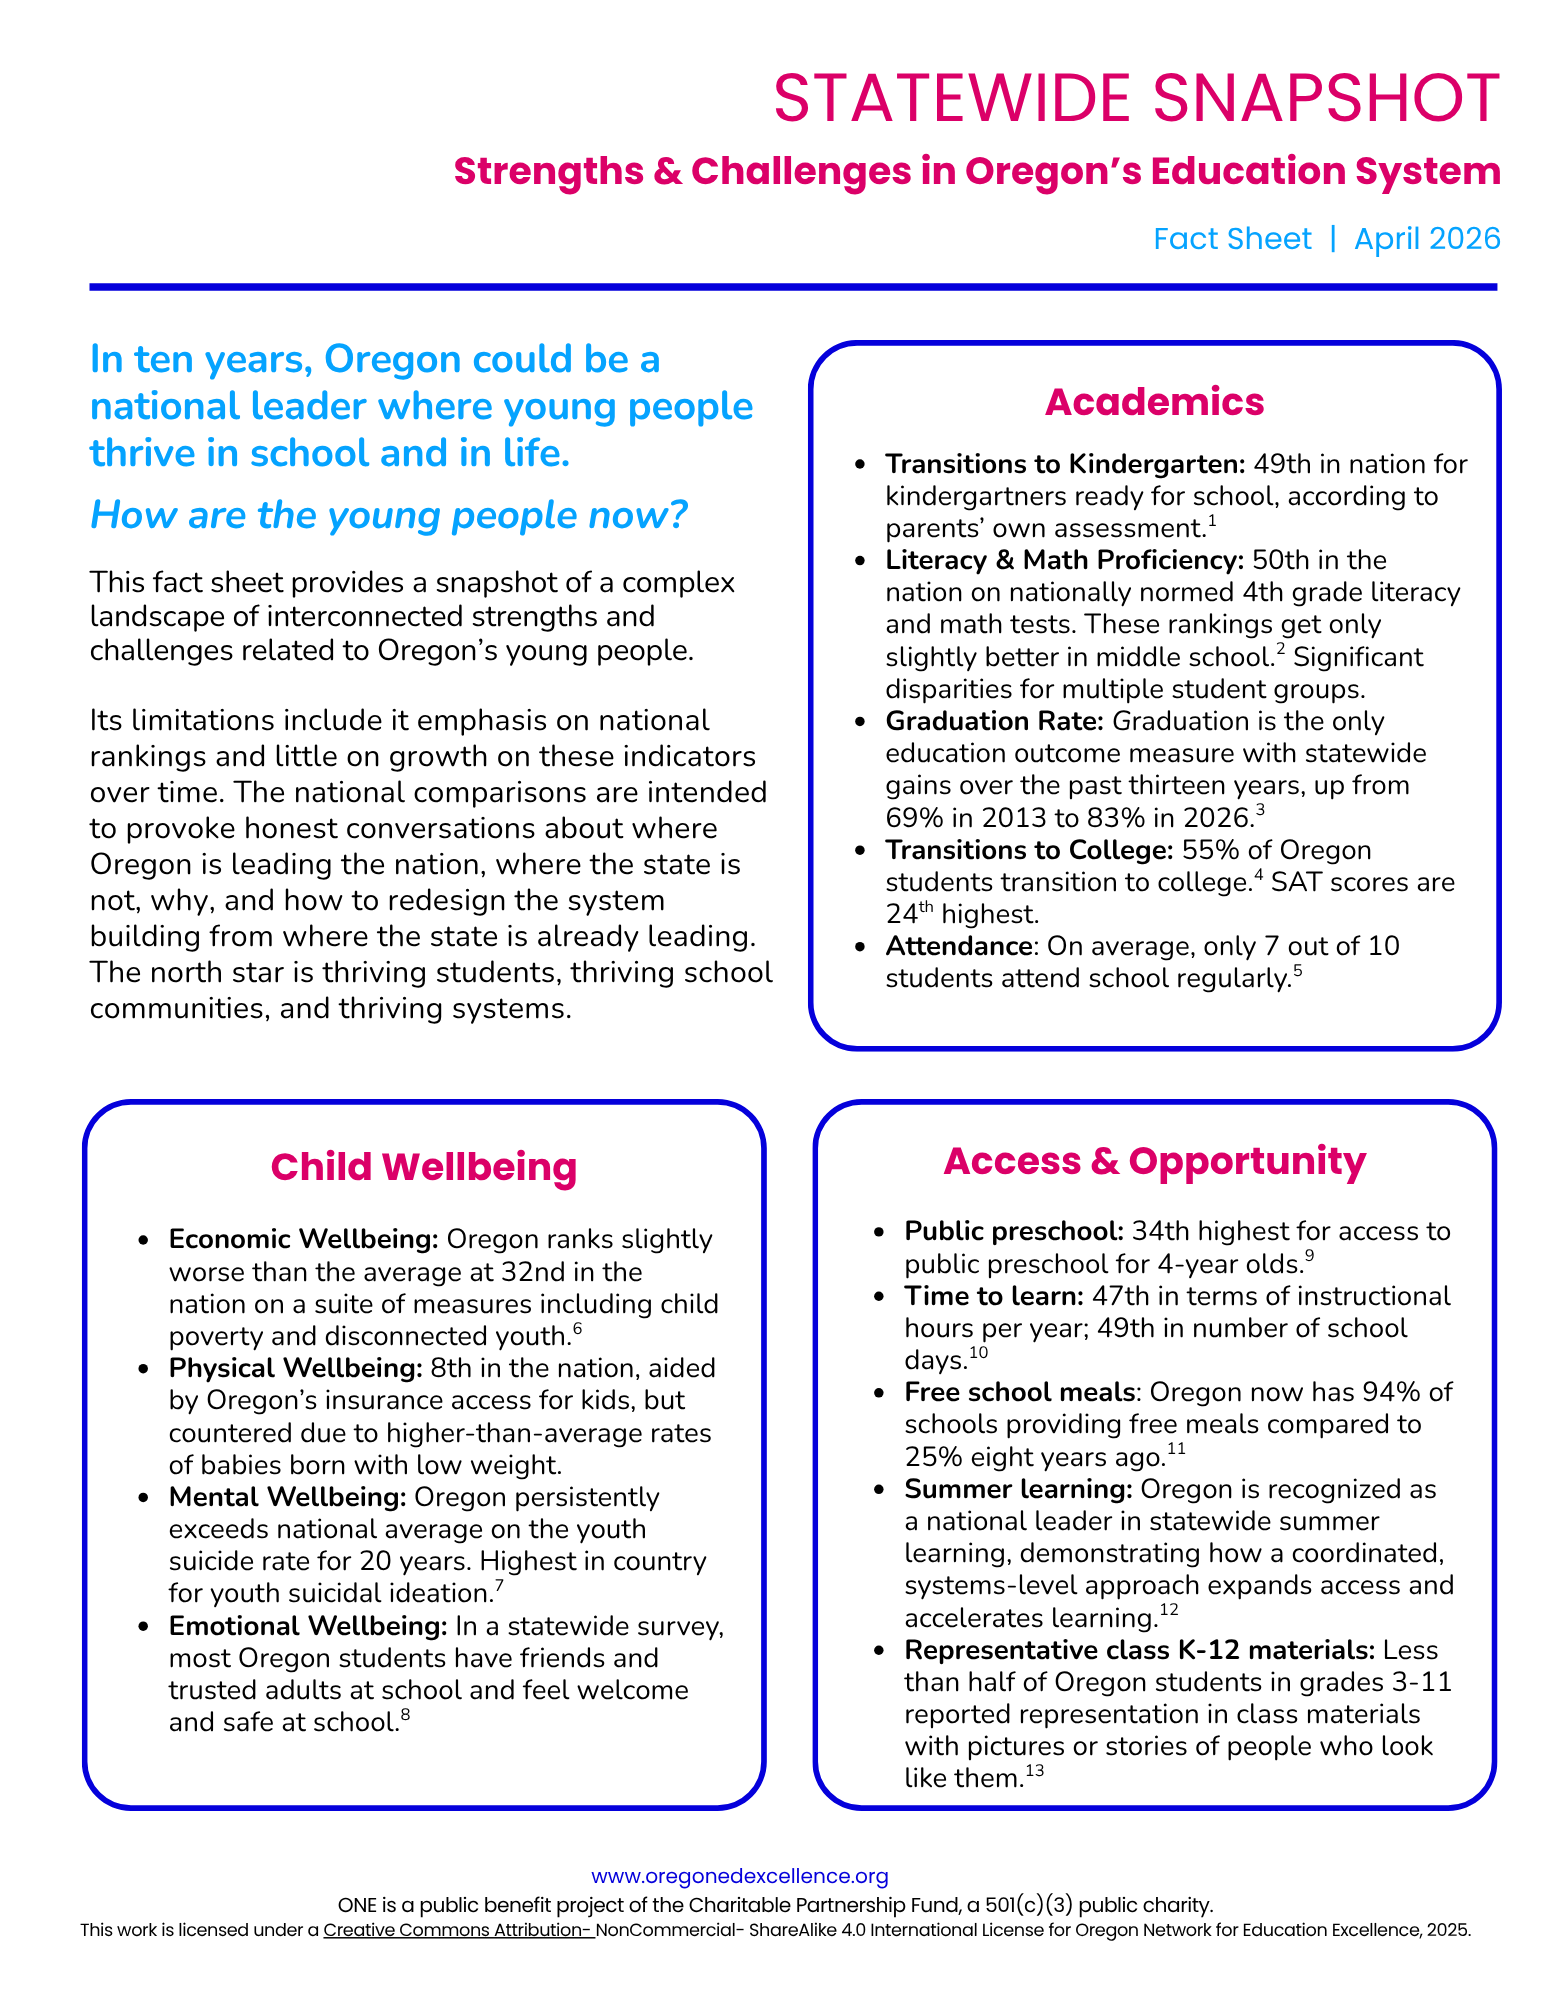
Statewide Snapshot of Oregon Education’s Strengths & Challenges
In ten years, Oregon could be a national leader where young people thrive in school and in life.
How are the young people now?
IN THIS FACT SHEET
Connect the dots between K-12 academic outcomes and:
Child wellbeing
Students’ access & opportunity
School communities
Statewide education system as designed
FAQ
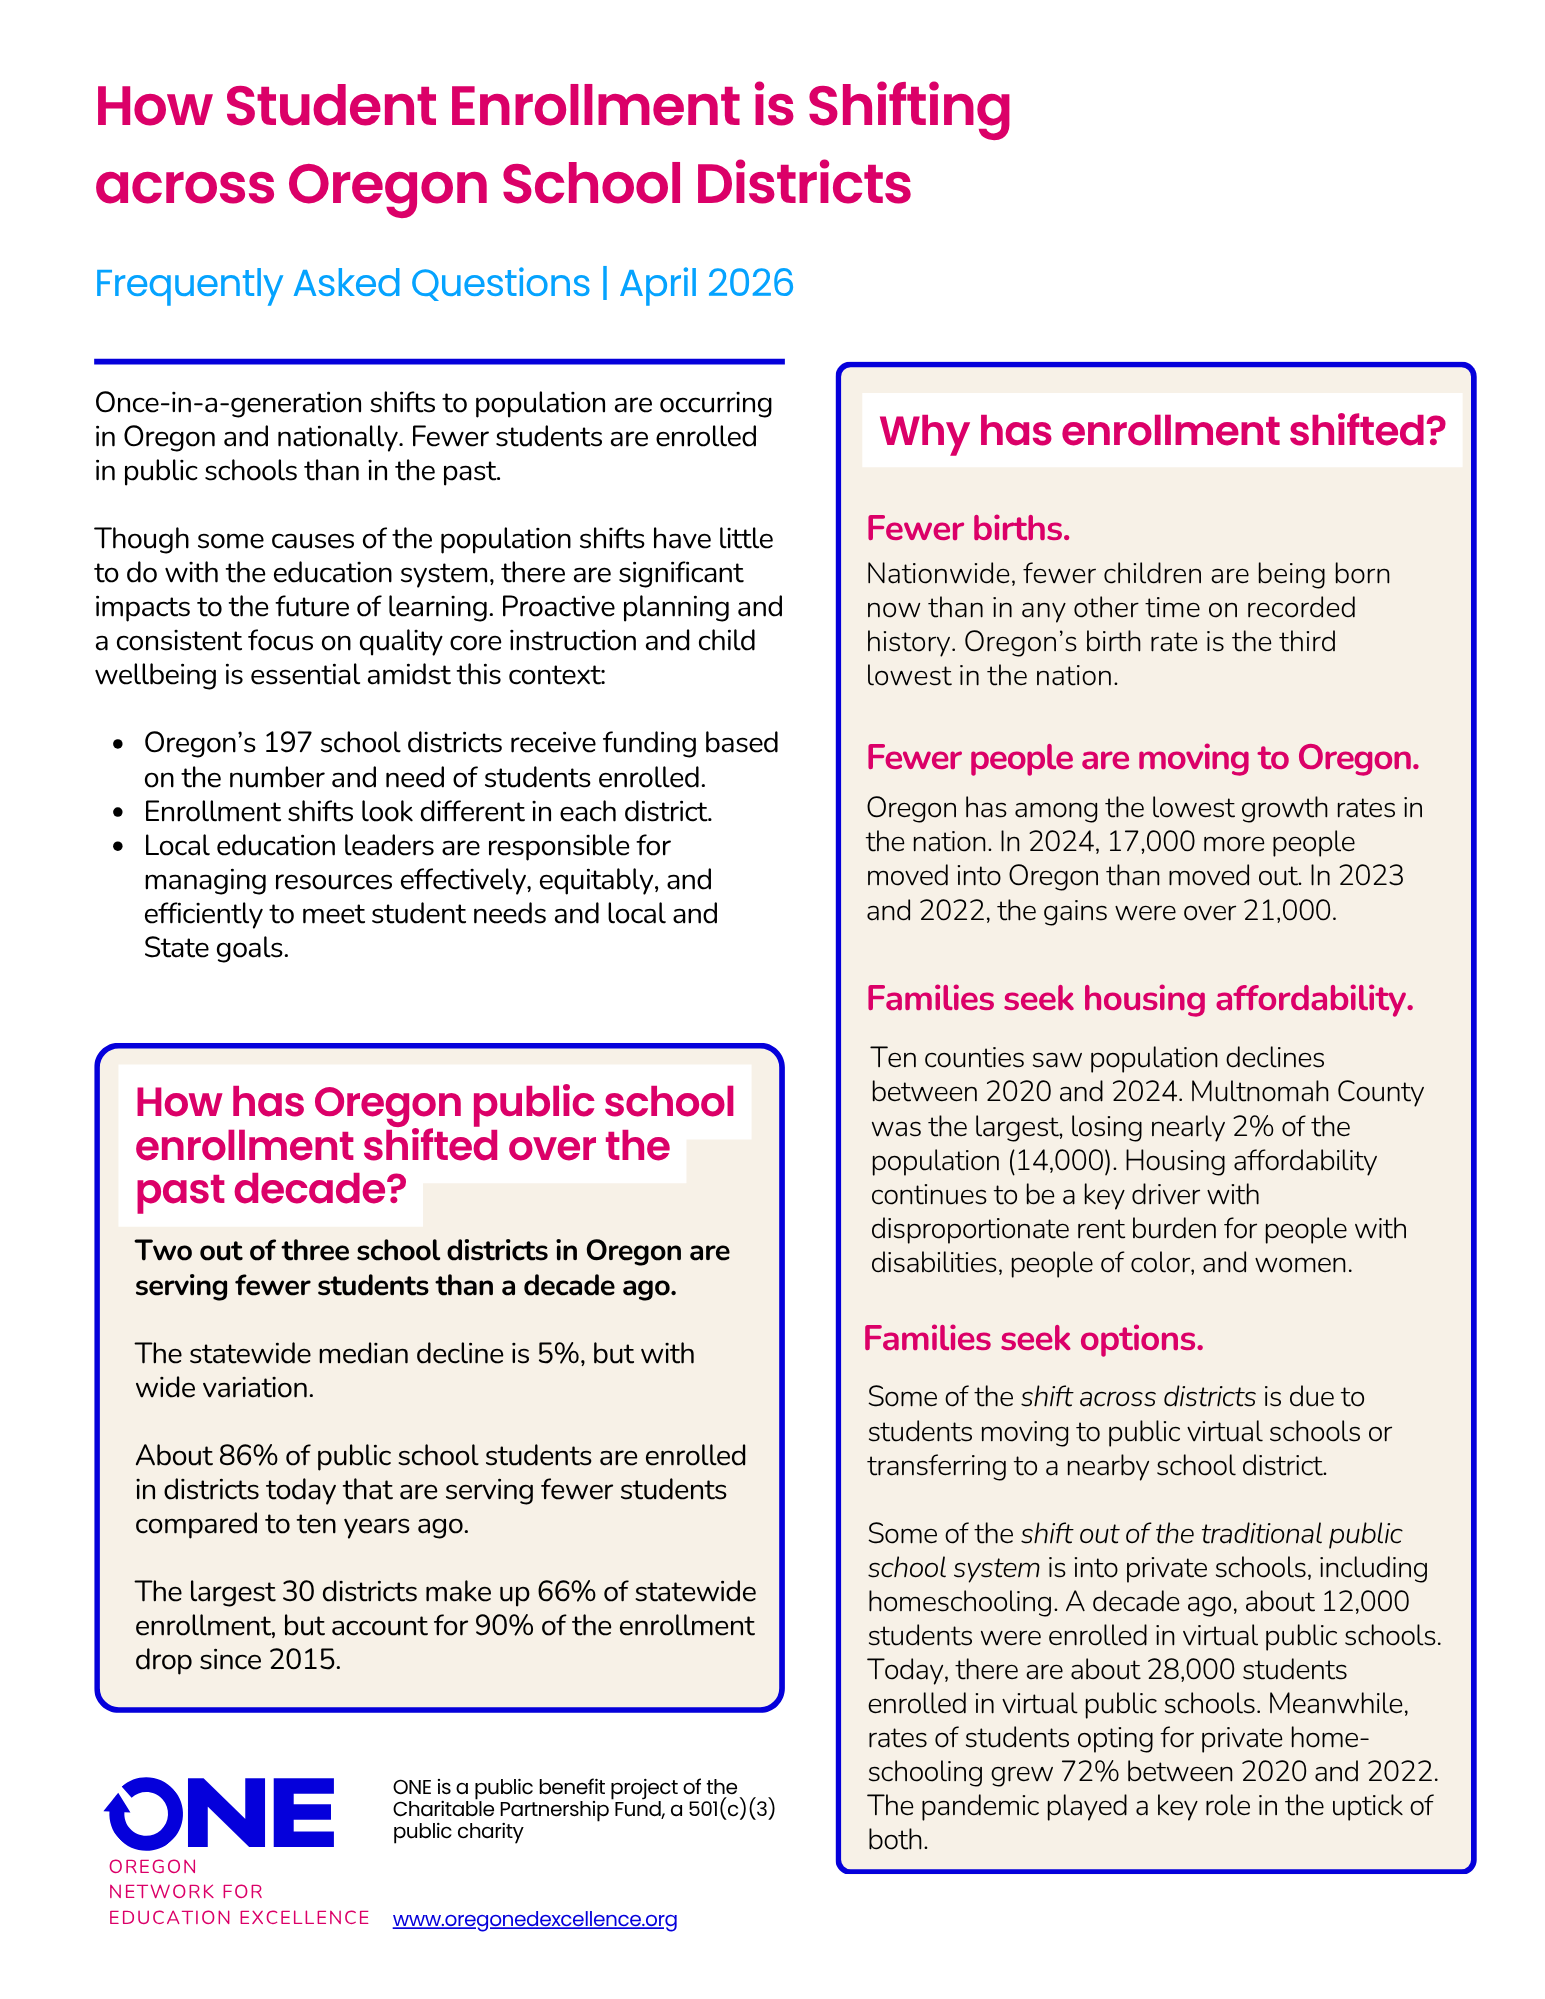
How Student Enrollment is Shifting across Oregon School Districts
Once-in-a-generation shifts to population are occurring in Oregon and nationally. Fewer students are enrolled in public schools than in the past.
Though some causes of the population shifts have little to do with the education system, there are significant impacts to the future of learning. Proactive planning and a consistent focus on quality core instruction and child wellbeing is essential amidst this context.
IN THIS FAQ
Connect the dots between enrollment shifts and:
Why enrollment is shifting
How enrollment has shifted over the past decade
Where enrollment is shifting
How trends vary by district and across the nation
What the shifts mean for Oregon school communities